@markdown
# Logistic Regression
____
- 뉴럴 네트워크와 딥러닝에서 중요한 컴포넌트로 `classification` 알고리즘 중 가장 정확도가 높다.
- logistic function : 0과 1을 가지는 함수(sigmoid 함수)
## Binary Classification
____
- 둘 중 하나를 고르는 알고리즘
- 기계적으로 학습하기 위해 카테고리를 0과 1로 나타낸다.
- 악성 종양 찾기, 주식시장 학습, 스팸 메일 등 다양한 곳에서 사용된다.
## Logistic Hypothesis
____
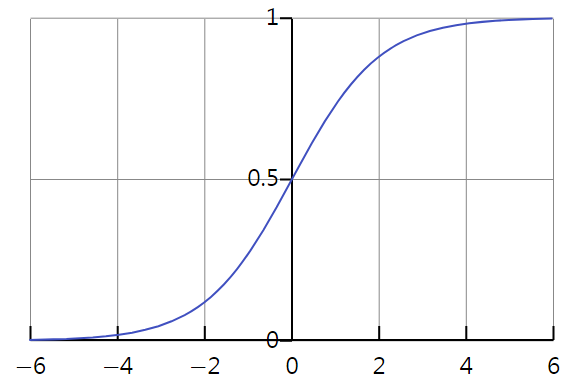
- Sigmoid : 0과 1사이의 값만 존재하는 함수

- sigmoid 함수를 기반으로 가설 함수 설정(위키백과 : [시그모이드함수](https://ko.wikipedia.org/wiki/%EC%8B%9C%EA%B7%B8%EB%AA%A8%EC%9D%B4%EB%93%9C_%ED%95%A8%EC%88%98))
- sigmoid 함수 그래프

[출처 : 위키백과 - 시그모이드 함수]
## Logistic Cost function
____
- 선형 회귀 모델에서의 Cost 최소값이 일정했지만, Logistic 가설 함수에는 지수함수(e(x))가 있기 때문에 S자 모양의 곡선이다.
따라서 Cost 함수의 그래프 또한 구불구불한 불규칙적인 모양이 된다.
- 위의 가설 함수를 가지고 Cost를 구하게 되면, 시작하는 점에 따라 최소값이 매번 달라지기 때문에 정확한 값을 찾기 어렵다.
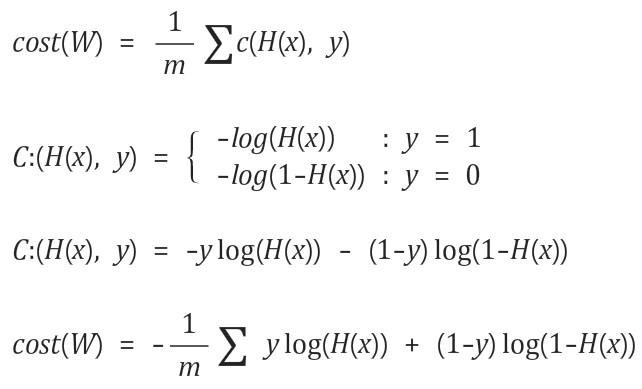
- 새로운 Cost 함수를 정의하여 0과 1 값을 나누도록 함수를 정의한다.

- Cost 함수가 0과 1을 갖도록 분류
>※ 김석훈 교수님의 Logistic Regression의 cost 함수 설명 강의 참고 ([https://www.youtube.com/watch?v=6vzchGYEJBc](https://www.youtube.com/watch?v=6vzchGYEJBc))
## Logistic Regression 구현
____
<pre><code class="python" style="font-size:14px">import tensorflow as tf
x_data = [[1, 2],
[2, 3],
[3, 1],
[4, 3],
[5, 3],
[6, 2]]
y_data = [[0],
[0],
[0],
[1],
[1],
[1]]
X = tf.placeholder(tf.float32, shape=[None, 2])
Y = tf.placeholder(tf.float32, shape=[None, 1])
W = tf.Variable(tf.random_normal([2, 1]), name='weight')
b = tf.Variable(tf.random_normal([1]), name='bias')
# sigmoid 사용한 가설 함수
hypothesis = tf.sigmoid(tf.matmul(X, W) + b)
# cost function
cost = -tf.reduce_mean(Y * tf.log(hypothesis) + (1 - Y) *
tf.log(1 - hypothesis))
# 로지스틱 회귀에서도 경사하강법을 통해 Cost의 최소값을 찾는다.
train = tf.train.GradientDescentOptimizer(learning_rate=0.01).minimize(cost)
# 가설함수가 0.5 이상이면 True, 이하이면 False
# float 형으로 Type Cast를 해주면 True = 1, False = 0이 된다.
predicted = tf.cast(hypothesis > 0.5, dtype=tf.float32)
# 정확도 계산, 예측한 값과 Y 값이 같으
accuracy = tf.reduce_mean(tf.cast(tf.equal(predicted, Y), dtype=tf.float32))
with tf.Session() as sess:
sess.run(tf.global_variables_initializer())
for step in range(10001):
cost_val, _ = sess.run([cost, train], feed_dict={X: x_data, Y: y_data})
if step % 2000 == 0:
print(step, cost_val)
# 정확도
h, c, a = sess.run([hypothesis, predicted, accuracy],
feed_dict={X: x_data, Y: y_data})
print("\n---Hypothesis--- \n", h, "\n---Correct(Y)---\n", c, "\n---Accuracy---\n", a)
</code></pre>
<pre><code class="python" style="font-size:14px">실행결과 : 예측한 H 값과 Y 값이 같은 것을 확인할 수 있다.
---step cost---
0 3.29647
2000 0.387903
4000 0.287101
6000 0.22452
8000 0.183446
10000 0.154883
---Hypothesis---
[[ 0.03303876]
[ 0.16184963]
[ 0.31568283]
[ 0.77648467]
[ 0.93644649]
[ 0.97912461]]
---Correct(Y)---
[[ 0.]
[ 0.]
[ 0.]
[ 1.]
[ 1.]
[ 1.]]
---Accuracy---
1.0
</code></pre>
<br/>
> 소스코드 - 모두를 위한 머신러닝 김석훈 교수님 강의 참고 : ([https://hunkim.github.io/ml/](https://hunkim.github.io/ml/))
'Deep Learning' 카테고리의 다른 글
| TensorFlow - Softmax Regression(2) (0) | 2017.07.13 |
|---|---|
| TensorFlow - Softmax Regression(1) (0) | 2017.07.12 |
| TensorFlow - Multi Variable Linear Regression(다중 선형회귀) (0) | 2017.07.08 |
| TensorFlow - Linear Regression(선형 회귀) (0) | 2017.07.06 |
| TensorFlow - 변수형 종류, 행렬 다루기 (0) | 2017.06.19 |